
How to Draw a Perfect Diagram for Scientific Study
A well-drawn diagram is a vital part of any scientific study. It not only simplifies complex data but also enhances the clarity and effectiveness of your presentation. Whether you are working on a biology experiment, a physics project, or a chemistry report, drawing the perfect diagram can greatly improve the understanding and impact of your work. This article outlines the key steps and tips to create a scientifically accurate and visually effective diagram.
1.Understand the Purpose of the Diagram
Before drawing, ask yourself what the diagram is supposed to communicate. Is it showing a process, a structure, a relationship between variables, or a measurement setup? Understanding the purpose will help you decide what elements are essential and how to arrange them effectively.
2.Plan Before You Draw
Sketch a rough layout of the diagram in pencil first. Identify the main parts or stages and think about how they connect. Label where each component will go and how the information will flow. This step helps prevent clutter and ensures a logical structure.
3.Use Sharp, Clear Lines
Use a ruler, compass, and other drawing tools for precision. Diagrams should be clean and neat, with all lines drawn carefully. Avoid freehand unless necessary. A tidy diagram gives a professional impression and makes it easier to read.
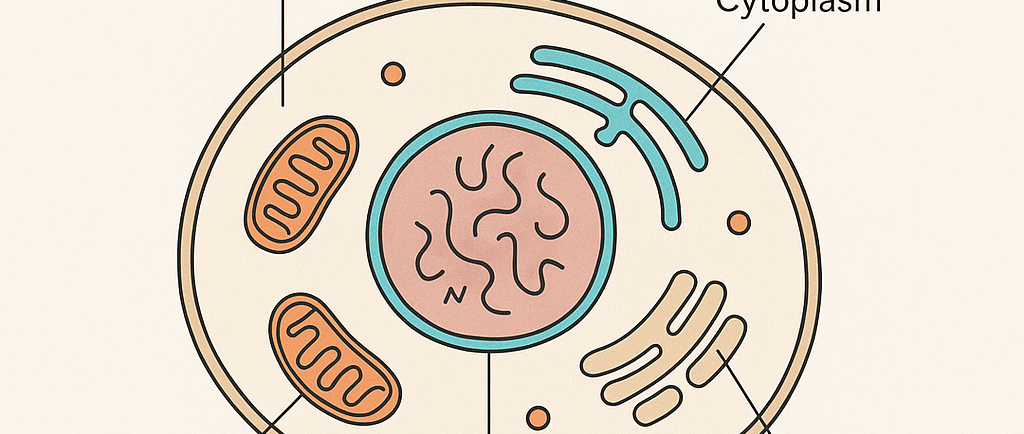
4.Label Everything Clearly
Labels are essential in scientific diagrams. Every part of the diagram should be named clearly and accurately. Use straight lines for pointers, and avoid overlapping text. Choose a readable font size and use capital letters consistently, especially for headings or major components.
5.Maintain Correct Proportions
Proportions should be as accurate as possible, especially in diagrams related to physics or engineering. For example, when drawing circuits, mechanical parts, or laboratory setups, scale and symmetry matter. If the diagram is not to scale, mention that clearly.
6.Use Standard Symbols and Conventions
Scientific diagrams often rely on standard symbols—such as those used in electrical circuits, chemical apparatus, or biological structures. Stick to these conventions unless instructed otherwise. This ensures that anyone with scientific knowledge can interpret your diagram correctly.
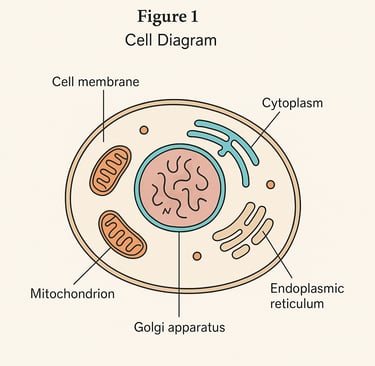
7.Add a Title and Key (if needed)
Always give your diagram a suitable title that reflects its content. If you are using colors, symbols, or shading, include a key or legend to explain what they represent. This is particularly useful in complex diagrams where visual aids help differentiate components.
8.Avoid Unnecessary Decoration
Scientific diagrams are meant to be functional, not decorative. Avoid using artistic elements like excessive colors, 3D effects, or patterns unless they serve a clear scientific purpose. Simplicity and clarity should be your goals.
9.Review and Revise
Once the diagram is complete, review it carefully. Check for spelling errors, misplaced labels, or missing parts. Ask yourself: “Would a person unfamiliar with the experiment understand this?” If not, make revisions.
Conclusion
Drawing a perfect diagram for a scientific study requires a mix of accuracy, clarity, and simplicity. By following a structured approach—planning your layout, using precise tools, labeling correctly, and sticking to standard conventions—you can create diagrams that enhance your scientific reports and effectively communicate your ideas.